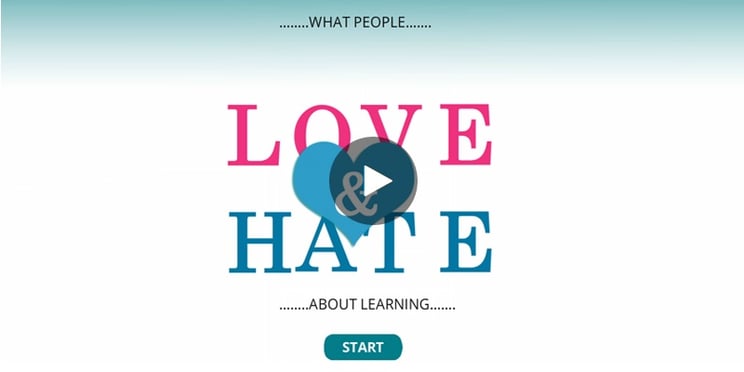
This week, e-learning challenge is to create an interactive graphic using the data from What People Love & Hate About E - Learning. Following is the procedure of how we have brought this forth.
Procedure:
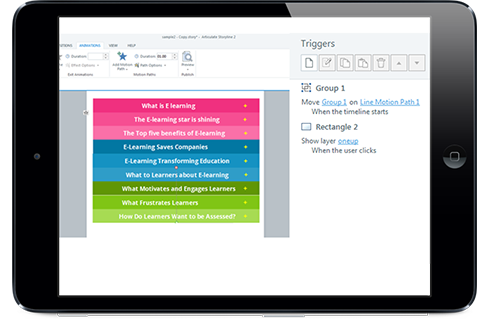
We have taken a base layer and for each option we have taken two different layers
Expand:
When user clicks on the rectangle to expand then we will enable navigation to the respective layer and by using motion option we have created animation which will start along with the time line of layer.

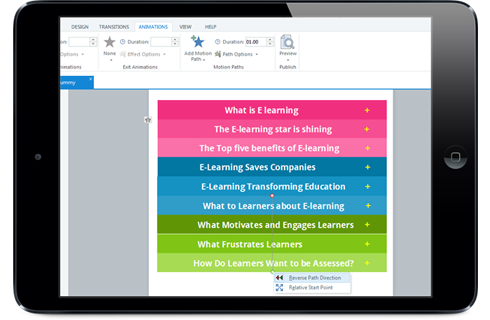
For collapse:
When user clicks on collapse we will enable navigation to the other layer and we have created animation by using reverse path direction in motion path.

Pixentia is an enthusiastic family of individuals, fervent to make lives simpler through effective use of technology. Our mission is to implement solutions that drives business results. Know more insights from our thoughts and experience.
Contact us today or call 1-855-978-6816 to talk with us about your business needs.


