


For years, industry leaders have been encouraging L&D to align itself to business and to measure and report on the impact of learning. We must admit, we spend lots of time on that soap box ourselves.
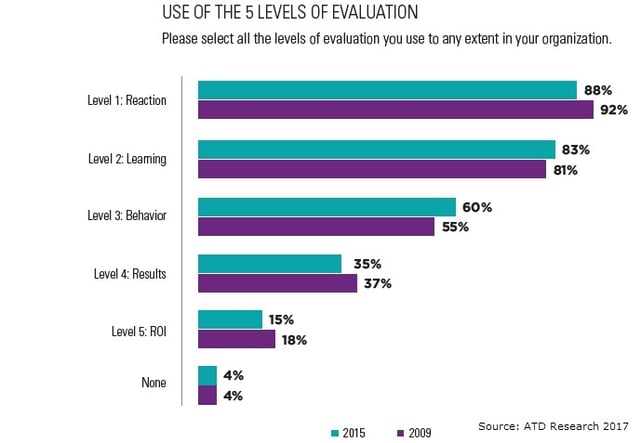
But if we take the latest ATD learning measurement survey as an indication, the profession has made no progress in measuring results or ROI. The study, conducted in 2015, actually showed decreases in those measurements since 2009.[1] It also shows us that most organizations still measure at Kirkpatrick levels 1 and 2. Only 36% of respondents said their evaluations were "helping to a large extent with meeting organizational business goals."
Why so little progress? The world of HR data analytics, including L&D, has become one of haves and have-nots. Big companies developed in-house analytics teams an iron consulting companies, while many others waited on the sidelines for analytics to become viable for them.
Analytics vendors jumped into the market, but most organizations still sat by waiting for industry leaders to prove the value of a significant investment in HR analytics. Vendors responded by working with HR analytics software vendors to embed their analytics engines into cloud HR platforms. Thus was born the idea of the “democratization of data.”
The advent of embedded analytics created a new wave of hype, and in the last two years or so we have seen some progress, but the number of organizations that come to us looking to span the gap between analytical tools and usability continues to grow. Embedded tools are a far cry from a robust library of reports and visualizations, and many companies find they just don’t have the resources or the expertise to build them.
Fractured Analytics
A host of conflicting agendas contributes to what Tracey Smith, author of many books on analytics, calls a fractured HR analytics world. She explains that with data scientists pulling in one direction and vendors in another, with some people advocating for regulation and publication of HR data and others clamoring for certifications in HR analytics, practitioners have lost focus. Smith encourages us to overcome this with focus and prioritization.
Focus on Internal Customers
We wholeheartedly agree. We find, in our practice, that those issues melt away when we focus on the needs of internal customers. When you are trying to help the operational leaders in your business get better results, it doesn’t matter that data scientists think you need a Ph.D. to do analytics and vendors believe analytics ought to be for everyone. Nor does it matter that regulators and social scientists disagree on what information we should be collecting and how public it should be.
If you been a learning professional for longer than a few minutes, you know about “smile sheets,” the feedback forms we like to use at the end of an instructor led training course. Their purpose is to capture learner reaction at level 1 of the Kirkpatrick measurement model.
Smile Sheets and Assessments for Data Collection
E-learning and SCORM standards have enabled us to take that simple tool and make learning assessments useful, and xAPI shows promise in enabling measurement of any type of learning. Every modern LMS has the tools to push out assessment questionnaires at any point in the learning cycle. We can create assessments to evaluate what takes place post-learning and whether formal or informal on-the-job learning is reinforcing classroom or online training. And we can request feedback from anyone at any time.
With that in mind, here a few recommendations for assessing the impact of learning on the business.
- Begin with a business problem or opportunity. Operational leaders in your organization have responsibility for organizational performance and have KPIs (Key Performance Indicators) or OKRs (Objectives And Key Results) they must meet. It makes sense for them to want to determine whether learning programs are having an impact on their metrics. Focus on what is important to them, and you will gain their support.
- Include your internal customer in the design or selection process. Help them meet their objectives.
- Plan your measurements and design your assessment tools before you launch the program. Include short, quick assessments for every phase of the learning lifecycle, and include learners, coaches, and managers in your assessment scope. Include assessments of retrieval practice, spaced repetitions, formal and informal on-the-job coaching, and social learning. Work with your internal customers to determine how you will capture performance data.
- Upgrade your smile sheets. Start by junking the Likert scales. Weed out weak questions and get specific about what you want to assess and how you set standards. Consider also what impact the questions you ask will have on behavior. For example, asking specific questions of learners about how much or how well supervisors provide time and resources to put skills into practice will set the standard for supervisor support of learning.[2]
- Get feedback on performance improvements from learners, coaches, and supervisors. Use your LMS assessment tools to capture the information.
If you follow these steps, you will have all the data you need to show the impact of learning on performance and will be able to use the visualization tools in your LMS embedded analytics to show the result.
Creating those visualizations starts with asking the right questions. Here is a sample to get you started:
- Does learning retention have a positive correlation to performance?
- How does learner feedback on supervisor support correlate with learning retention?
- How does social learning interaction compare with learning retention? With performance?
- How does each of the post learning activities impact learning retention?
We hope we have shown here that you can measure the impact of learning without investing in more expensive technology. You can use the tools you have to get an excellent idea of how your learning and support programs are impacting business performance.
References:
1. "ATD Research Presents - Evaluating Learning: Getting to Measurements That Matter." ATD. April 2016.
2. Thalheimer, Will. Performance-focused smile sheets: a radical rethinking of a dangerous art form. United States: Work-Learning Press, 2016.
Pixentia is a full-service technology company dedicated to helping clients solve business problems, improve the capability of their people, and achieve better results.
