
Integrations between different HCM systems and vendors get complex at times and we end up using multiple transformations and expressions to meet the requirements. Once the integration is launched after successful design and development of the integration, the output is delivered if everything goes well. If not the integration shows an error message which is too complex to locate in the cluster of components. This will end up in a position where we need to check the integration from starting so as to configure every step again until the error is identified and fixed. Considering these types of issues, there is a need to highlight the process to troubleshoot problems in an assembly source code. Let’s go through some of the steps about how assembly debugging works in Workday®.
Steps involved in debugging an assembly:
Creating or Setting up a toggle assembly breakpoint : Breakpoints enable us to stop the integration at that particular step for analyzing before moving forward. Toggle assembly breakpoints can be added on all mediation steps and majority of other components.
For creating an assembly breakpoint, just right-click on the context you need to analyse and set the toggle assembly breakpoint. Breakpoint can be located by observing blue dot on the right corner of the component
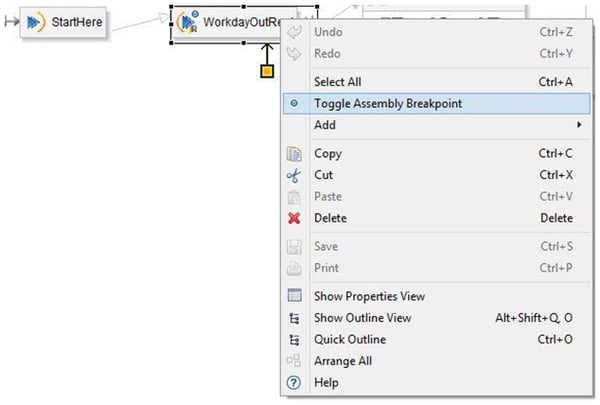 However we cannot assign breakpoint to transport components, as their function is to kick off the assembly rather than processing an actual message.
Launching a debug session: Debug session can be launched from the cloud explorer. Select the respective integration in the cloud explorer then drill down the tree to the assembly start i.e., a in-transport node most likely Workday®-in node. Right click on that node and select Debug Integration.
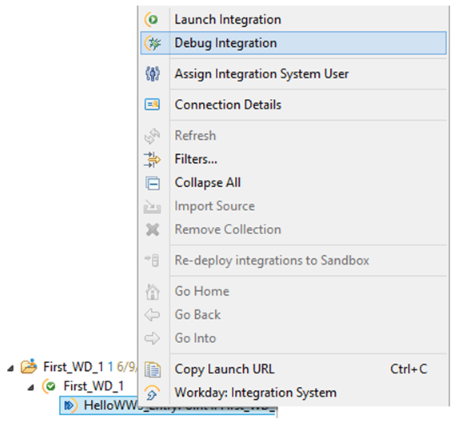
- After selecting Debug integration you will be asked to select the environment where you can make selections between sandbox and production. You can also select Document Retrieval options where documents can be loaded manually without waiting for the retrieval service to complete before debugging. Once this is configured, from the second and subsequent occasions when Debug Integration is selected through email, the previous configuration is loaded. After you click on Debug in the debug integration window. debug kicks off and Eclipse Perspective is changed to debug mode.
- In the debug session we see a green box around the toggle assembly breakpoint component. This
 that integration stops here until the user tells it to move to the next step. "Message root part" tab on the assembly debug view gives us the complete idea on entire contents of the message root part which is nothing but the message content of that particular component.
Once this is checked, we can move forward by clicking on the step over button on the top or use F6.
We can check for the outputs or results for mainly Eval expressions by clicking on the Scratchpad on the Assembly Debug view. We can write different expressions to obtain their respective results. For example in this integration the Eval Expression is picking up the names of the employees one by one from the splitter. So, we can enter an expression “props[“Name”]” to check the output of Eval step which is Logan McNeil
- If the debug process stops at executing any step then it indicates that there is an error at that specific point or in that component. Once the error is found we rectify the error accordingly.
- Then once again after rectifying the error go to step 2 which makes you to deploy the integration again into the tenant so that your new file is deployed into the tenant before running the debug again.
This type of debugging help us to identify the exact root cause of the problem. So, we can act on that problem and debug again in the same process until all the issues with the integration are successfully debugged and resolved. We can determine the outcome by looking at the console which prints out the integration debug status messages.
Overall integrations tend to become complex, with efficient debugging methods and strategies, we would be able to find solution to our integrations issues in a better way.


Leave a Comment